Market Outlook
March 14, 2018
Market Cues
Domestic Indices
Chg (%)
(Pts)
(Cl ose)
Indian markets are likely to open negative tracking global indices and SGX Nifty.
BSE Sensex
(0.2)
(61)
33,857
U.S. stocks moved lower over the course of the trading session. The major averages
Nifty
0.1
5
10,427
all slid into negative territory, with the tech-heavy Nasdaq pulling back off a record
Mid Cap
1.0
161
16,269
high. The Dow fell down by 0.7% to close at 25,007. The NASDAQ dropped down
Small Cap
1.1
199
17,602
by 1.0% to close at 7,511.
Bankex
0.4
121
27,905
U.K. stocks were little changed in choppy trade as caution prevailed ahead of U.S.
consumer inflation data due later in the day. The FTSE 100 was down by 1.1% to
Global Indices
Chg (%)
(Pts)
(Cl ose)
end at 7,139.
Dow Jones
(0.7)
(172)
25,007
On domestic front, Indian shares swung between gains and losses before closing
Nasdaq
(1.0)
(77)
7,511
largely unchanged as traders opted to book some profits following the previous
FTSE
(1.1)
(76)
7,139
session's sharp rally. The BSE Sensex ended down by 0.2% at 33,857.
Nikkei
(0.9)
(203)
21,765
News Analysis
Hang Seng
(1.3)
(398)
31,203
States issued Rs 283.98bn as GST compensation till Dec
Shanghai Com
(0.4)
(14)
3,296
Detailed analysis on Pg2
A dvances / Declines
BSE
NSE
Investor’s Ready Reckoner
Advances
1,710
1,215
Key Domestic & Global Indicators
Declines
1,010
579
Stock Watch: Latest investment recommendations on 150+ stocks
Unchanged
152
75
Refer Pg5 onwards
Top Picks
Volumes (` Cr)
C MP
Target
U psi de
C ompany
Sector
R ating
BSE
4,469
(`)
(`)
(%)
Blue Star
Capital Goods Accumulate
791
867
9.6
NSE
44,681
Dewan Housi ng Finance
Financials
Buy
516
720
39.5
Century Plyboards
Forest Products
Buy
326
400
22.5
Net Inflows (` Cr)
Ne t
Mtd
Ytd
Navkar Corporation
Other
Buy
159
265
67.0
FII
1,413
3,406
3,898
KEI Industrie s
Capital Goods
Buy
370
436
18.0
*MFs
(273)
(455)
24,750
More Top Picks on Pg4
Key Upcoming Events
Top Gainers
Price (`)
Chg (%)
Previous
C onsensus
D ate
Region
Event Description
Reading
Expectations
Fconsumer
60
19.2
Mar14
India
Monthly Wholesale Prices YoY%
2.84
2.50
Andhrabank
39
10.0
Mar14
US
Initial Jobless claims
231.00
227.50
Pcjeweller
364
7.6
Mar15
US
Producer Price Index (mom)
0.70
Bankindia
102
7.5
Mar15
India
Imports YoY%
26.10
Mar15
US
Industrial Production
(0.05)
0.40
Avanti
2,450
7.4
More Events on Pg7
Top Losers
Price (`)
Chg (%)
Tcs
2,892
(5.2)
Apollohosp
1,098
(2.9)
Prestige
297
(2.6)
Crompton
228
(2.5)
Syngene
565
(2.3)
As on March 13, 2018
Market Outlook
March 14, 2018
News Analysis
States issued Rs 283.98bn as GST compensation till Dec
The Centre has released Rs 283.98 billion as GST compensation to states for July-
December, with Karnataka getting a major pie. According to reports, states are
protected from any revenue loss on account of implementation of the new indirect
tax regime under the Goods and Services Tax law.
The government has lowered the indirect tax revenue collection forecast in the
revised estimates by Rs 518.56 billion to Rs 8.75 trillion in the current fiscal. As per
the Budget estimates, over Rs 9.26 trillion was to be collected from indirect taxes.
During July-December 2017, Rs 41.30 billion has been released as compensation
to Karnataka, followed by Rs 28.38 billion to Punjab, Rs 25.32 billion to Gujarat,
Rs 21.19 billion to Bihar, Rs 19.11 billion to Rajasthan and Rs 15.20 billion to
Uttar Pradesh, among various states.
Economic and Political News
Odisha Mining Corporation gears up to hold bauxite e-auctions in April
Metro railway companies look at financial viability to reduce government
funding
States issued Rs 283.98bn as GST compensation till Dec
Corporate News
NCLT stops Bhushan Power creditors from conducting meets on resolution
plan
Lupin gets USFDA nod for contraceptive tablet 'Tydemy' for women
NSE fines Gitanjali Gems, 23 other firms for not filing financial results
Sequoia-backed payments firm Pine Labs raises $82 mn from Actis,
Altimeter
Market Outlook
March 14, 2018
Top Picks
Market Cap
C MP
Target
Upside
C ompany
R ationale
(` Cr)
(`)
(`)
(%)
Strong growth in domestic business due to its
leade`hip in acute therapeutic segment. Alkem expects
Alkem Laboratories
26,270
2,197
2,441
11.1
to launch more products in USA, which bode s for its
international business.
Favorable outlook for the AC industry to augur well for
Cooling products busine ss which is out pacing the
Blue Star
7,591
791
867
9.6
market growth. EMPPAC division's profitability to
improve once operating environment turns around.
With a focus on the low and medium income (LMI)
consumer segment, the company has increased its
Dewan Housi ng Finance
16,189
516
720
39.5
presence in tier-II & III cities where the growth
opportunity i s immense.
Well capitalized with CAR of
18.1% which give s
sufficient room to grow asset base. Faster resolution of
ICICI Bank
195,338
304
416
36.6
NPA would reduce provision cost, which would help to
report better ROE.
High order book execution in EPC segment, rising B2C
KEI Industrie s
2,896
370
436
18.0
sales and higher exports to boost the revenues and
profitability
Expected to benefit from the lower capex requirement
Music Broadcast
2,166
380
475
25.1
and 15 ye ar long radio broadcast licensing.
Massive capacity expansion along with rail advantage
Navkar Corporation
2,389
159
265
67.0
at ICD as well CFS augur well for the company
Strong brands and distribution network would boost
Siyaram Silk Mills
2,961
632
851
34.7
growth going ahead. Stock currently trade s at an
inexpensive valuation.
Market leadership in Hi ndi news genre and no.
2
viewership ranking in English news genre, exit from the
TV Today Network
2,718
456
508
11.5
radio business, and anticipate d growth i n ad spends
by corporate to benefit the stock.
After GST, the company is expected to see higher
volume s along with improving product mix. The
Maruti Suzuki
2,64,426
8,754
10,619
21.3
Gujarat plant will also e nable higher operating
leverage which will be margin accretive.
We expect loan book to grow at 24.3% over next two
GIC Housing
2,139
397
655
64.9
year; change in borrowing mix will help in NIM
improve ment
We expect CPIL to report net Revenue/PAT CAGR of
~17%/ 16% over FY2017-20E mainly due to he althy
7,253
326
400
22.5
growth in plywood & lamination busi ness, forayed into
Century Plyboards India
MDF & Particle boards on back of strong brand &
distribution network.
We expect sales/PAT to grow at 13.5%/20% over next
LT Foods
2,765
86
128
48.1
two years on the back of strong distribution network &
addition of new products in portfolio.
Third largest brand pl ay in luggage segment Increased
product offerings and improving distri bution network is
Safari Industries
1,181
531
650
22.4
leading to strong growth in business. Likely to post
robust growth for next 3-4 years
We expect HSIL to report PAT CAGR of ~15% over
FY2017-20E owing to better improve ment in operating
HSIL
2,969
411
510
24.2
margin due price hike in container glass segment,
turnaround in consumer business.
We expect financialisation of savings and increasing
Aditya Birla Capital
33728
154
218
41.5
penetration in Insurance & Mutual fund would ensure
steady growth.
Source: Company, Angel Research
Market Outlook
March 14, 2018
Fundamental Call
Market Cap
C MP
Target
Upside
C ompany
R ationale
(` Cr)
(`)
(`)
(%)
CCL is likely to maintain the strong growth trajectory
CCL Products
3,882
292
360
23.4
over FY18-20 backed by capacity expansi on and new
geographical foray
We forecast Nilkamal to report top-line CAGR of ~9%
to `2,635cr over FY17-20E on the back of healthy
Nilkamal
2,510
1,682
2,178
29.5
demand growth in pl astic division. On the bottom -line
front, we estimate ~10% CAGR to `162cr owing to
improve ment in volumes.
We expect sales/PAT to grow at 9%/ 14% over next two
years on the back of healthy demand growth in
Shreyans Industries
191
138
247
79.2
printing. Further, China had banned maki ng paper
from waste pulp which would benefit Indian paper
companie s.
The prism has diversified exposure in the different
segment such as Cement, Tile & ready mix concrete.
Prism Cement
5,932
118
160
35.8
Thus we believe, PCL is in the right place to capture
ongoing government spendi ng on affordable housing
and infrastructure projects.
Elantas Beck India is the Indian market leader in liquid
insulation segment use d in electrical equipments like
Elantas Beck India Ltd
1,614
2,036
2,500
22.8
motors, transformers etc. It derives demand from
several industries which are expected to register 10%+
CAGR in demand in the coming years.
RPL to report healthy top-line CAGR of ~13% over
FY17-20E on the back of healthy de mand in printing &
Ruchira Papers Ltd.
378
169
244
44.6
writing paper segments. On the bottom-line front, we
estimate ~16% CAGR over FY17-20E owing to strong
improve ment in operating performance.
Greenply Industries Ltd (GIL) manufactures plywood &
allied products and medium density fibreboards
(MDF). GIL to report net reve nue CAGR of ~14% to
Greenply Industries
3,998
326
395
21.2
~`2,478cr over F Y2017-20E mainly due to healthy
growth in plywood & lamination busine ss on the back
of strong brand and di stribution network
Source: Company, Angel Research
Market Outlook
March 14, 2018
Key Upcoming Events
Global economic events release calendar
Bl oomberg Data
D ate
Time
C ountry
Event Description
Unit
Period
L ast Reporte d
E stimate d
Mar 14, 2018
12: 00 PM India
Monthly Wholesale Prices YoY%
% Change
Feb
2.84
2.50
6:00 PM US
Initial Jobless claims
Thousands
Mar 10
231.00
227.50
Mar 15, 2018
US
Producer Price Index (mom)
% Change
Feb
0.70
India
Imports YoY%
% Change
Feb
26.10
6:45 PM US
Industrial Production
%
Feb
(0.05)
0.40
Mar 16, 2018
India
Exports YoY%
% Change
Feb
9.10
3:30 PM Euro Zone
Euro-Zone CPI (YoY)
%
Feb F
1.20
1.20
6:00 PM US
Housi ng Starts
Thousands
Feb
1,326.00
1,290.00
6:00 PM US
Building permits
Thousands
Feb
1,377.00
1,320.00
Mar 20, 2018
8:30 PM Euro Zone
Euro-Zone Consumer Confidence
Value
Mar A
0.10
3:00 PM UK
CPI (YoY)
% Change
Feb
3.00
Mar 21, 2018
7:30 PM US
Existing home sales
Million
Feb
5.38
5.42
3:00 PM UK
Joble ss claims change
% Change
Feb
(7.20)
11: 30 PM US
FOMC rate decision
%
Mar 21
1.50
1.75
Mar 22, 2018
2:00 PM Germany
PMI Services
Value
Mar P
55.30
2:00 PM Germany
PMI Manufacturing
Value
Mar P
60.60
7:30 PM US
New home sales
Thousands
Feb
593.00
617.50
Mar 23, 2018
5:30 PM UK
BOE Announce s rate s
% Ratio
Mar 22
0.50
Mar 27, 2018
7:30 PM US
Consumer Confidence
S.A./ 1985=100
Mar
130.80
Mar 28, 2018
6:00 PM US
GDP Qoq (Annualise d)
% Change
4Q T
2.50
Mar 29, 2018
1:25 PM Germany
Unempl oyment change (000's)
Thousands
Mar
(22.00)
2:00 PM UK
GDP (YoY)
% Change
4Q F
1.40
Mar 31, 2018
6:30 AM China
PMI Manufacturing
Value
Mar
50.30
Apr 03, 2018
2:00 PM UK
PMI Manufacturing
Value
Mar
55.20
Source: Bloomberg, Angel Research
Market Outlook
March 14, 2018
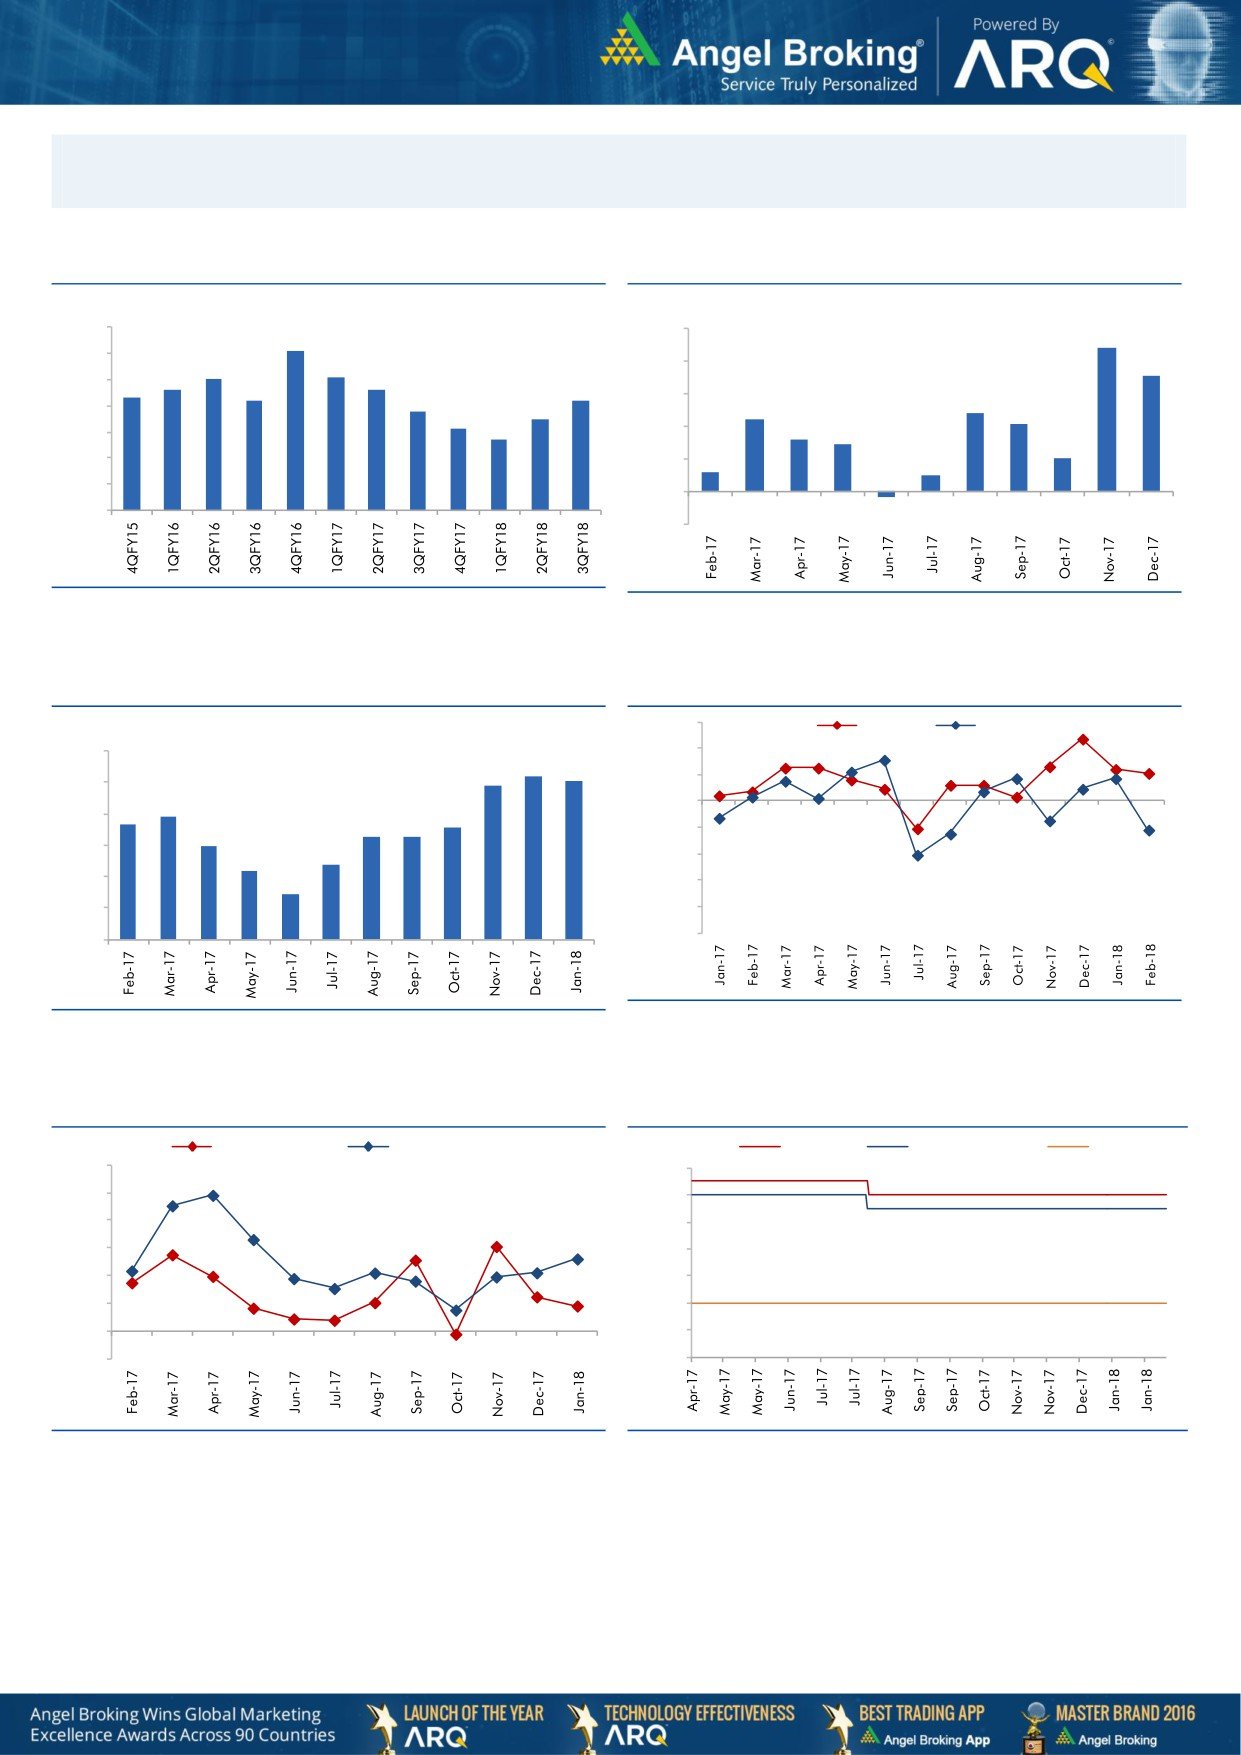
Macro watch
Exhibit 1: Quarterly GDP trends
Exhibit 2: IIP trends
(%)
(%)
10.0
10.0
9.1
8.8
9.0
8.0
8.1
8.0
7.1
7.6
7.6
8.0
7.3
7.2
7.2
6.8
6.0
4.8
7.0
6.5
4.4
6.1
4.1
5.7
4.0
3.2
2.9
6.0
2.0
5.0
2.0
1.2
1.0
4.0
-
3.0
(0.3)
(2.0)
Source: CSO, Angel Research
Source: MOSPI, Angel Research
Exhibit 3: Monthly CPI inflation trends
Exhibit 4: Manufacturing and services PMI
56.0
Mfg. PMI
Services PMI
(%)
6.0
54.0
5.2
5.1
4.9
52.0
5.0
3.9
50.0
3.7
3.6
4.0
3.3
3.3
3.0
48.0
3.0
2.4
2.2
46.0
2.0
1.5
44.0
1.0
42.0
40.0
-
Source: Market, Angel Research; Note: Level above 50 indicates expansion
Source: MOSPI, Angel Research
Exhibit 5: Exports and imports growth trends
Exhibit 6: Key policy rates
(%)
Exports yoy growth
Imports yoy growth
(%)
Repo rate
Reverse Repo rate
CRR
60.0
6.50
50.0
6.00
40.0
5.50
30.0
5.00
20.0
4.50
10.0
4.00
0.0
3.50
(10.0)
3.00
Source: Bloomberg, Angel Research
Source: RBI, Angel Research
Market Outlook
March 14, 2018
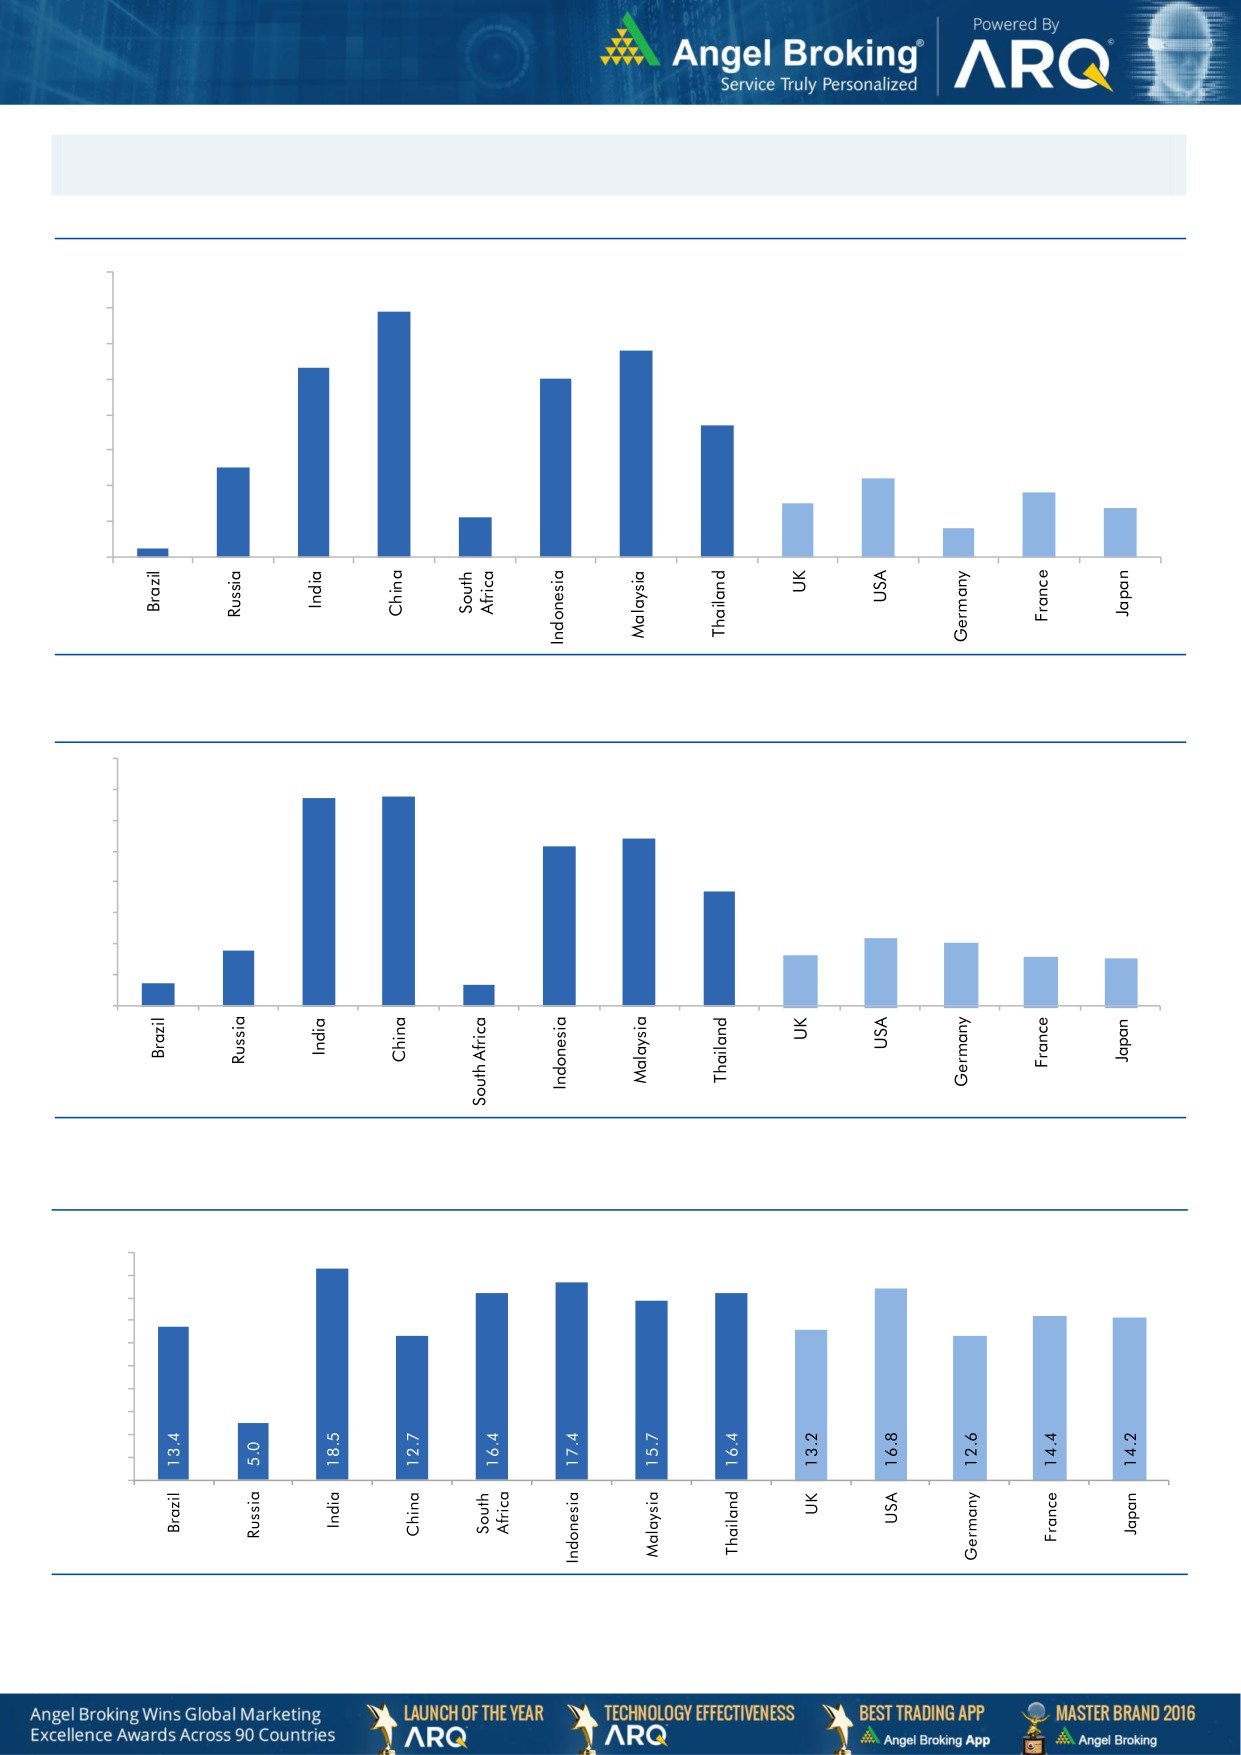
Global watch
Exhibit 1: Latest quarterly GDP Growth (%, yoy) across select developing and developed countries
(%)
8.0
6.9
7.0
5.8
6.0
5.3
5.0
5.0
1.1
3.7
4.0
2.5
3.0
2.2
1.8
2.0
1.5
1.4
0.8
1.0
0.3
-
Source: Bloomberg, Angel Research
Exhibit 2: 2017 GDP Growth projection by IMF (%, yoy) across select developing and developed countries
(%)
6.7
6.8
7.0
6.0
5.4
5.2
5.0
3.7
4.0
3.0
1.8
2.2
2.0
1.7
1.6
2.0
0.7
1.5
0.7
1.0
-
Source: IMF, Angel Research
Exhibit 3: One year forward P-E ratio across select developing and developed countries
(x)
20.0
18.0
16.0
14.0
12.0
10.0
8.0
6.0
4.0
2.0
-
Source: IMF, Angel Research
Market Outlook
March 14, 2018
Exhibit 4: Relative performance of indices across globe
Returns (%)
C ountry
Name of index
Closing price
1M
3M
1YR
Brazil
Bovespa
86,384
4.4
19.1
30.2
Russia
Micex
2,319
2.9
9.2
16.0
India
Nifty
10,427
(0.5)
2.6
16.8
China
Shanghai Composite
3,310
(5.4)
0.1
2.0
South Africa
Top 40
52,372
6.3
1.4
18.2
Mexico
Mexbol
48,557
1.6
3.3
3.1
Indonesia
LQ45
1,057
(3.9)
3.7
17.8
Malaysia
KLCI
1,864
1.3
8.5
9.1
Thailand
SET 50
1,196
3.4
8.9
21.6
USA
Dow Jones
25,007
4.8
3.3
20.0
UK
FTSE
7,139
0.7
(3.5)
(3.1)
Japan
Nikkei
21,968
0.4
(0.9)
13.4
Germany
DAX
12,221
0.9
(7.1)
1.9
France
CAC
5,243
3.2
(2.9)
4.2
Source: Bloomberg, Angel Research p68in4